Year One Client Data
We had our very first client in October 2019. Since then, we have expanded to our own storefront, started a Youth Council, and added new programming. We wanted to look back on our first year and a half of operations to identify important trends. The data is from June 2021 and before, covering 142 clients. It is pulled from our appointment intake form, where clients specify their style and personal details to help them find items in their size and style. Read on for our findings!
The first category we considered is age. As expected, the majority of our clients were between 13 and 15. Those early teenage years are ripe for self discovery. But also notable is the scope of ages. We’ve had clients as young as 7 and as old as 19. It shows that there is a broad range of need (which is why we recently expanded our services to age 25!).
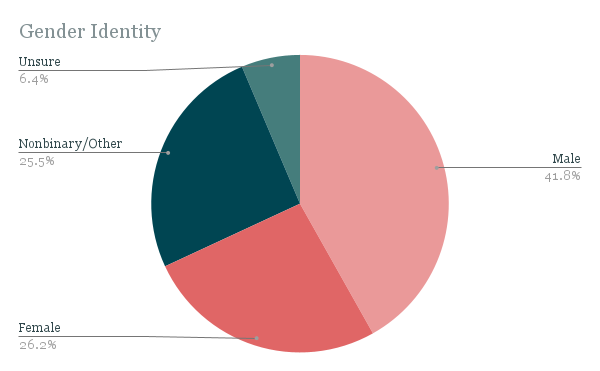
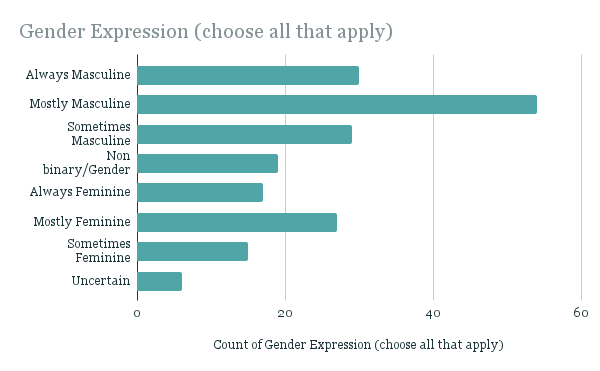
Another interesting set of data is gender identity and gender expression. We have served clients across the gender spectrum, including those who aren’t quite sure yet. Having the specific numbers helps us target our donation requests (for example, the largest identity group is male, so right now, we are asking for more masculine clothing). However, it is important to note that identity and expression are not the same thing. While we had 59 clients identify as male, only 30 were always masculine in their gender expression. Our clients often want to play with gender norms, and we are happy to offer them the space to do so.
We also found that 76.4% of our clients have the support of friends and family. This is great to hear! A strong support system is integral to mental health. But this number is also much higher than the estimated national average (In 2018, Human Rights Campaign found that “less than a quarter of transgender and gender expansive youth feel like they can definitely be themselves at home.” We can’t know the reason for this, but it does imply that an accepting family opens the door to more resources. Looking to the future, we may want to consider how to reach those who are in less accepting environments.
On a similar note, we tracked how clients found out about us. 43.2% were through friends or family, which makes sense with the information above. The large portion that found us through doctors and teachers reinforces the importance of community partnerships. When we have strong roots in the community, it makes us more visible and accessible. An intriguing segment is the 21.6% from social media. Social media is one of the only ways we can reach out to young people directly. We’re hoping that efforts like expanding our TikTok presence can grow this number.
We also collected info on the more practical things like sizing. In the below chart, you can see men’s and women’s shoe sizes. This reveals the unique considerations a trans-focused shop has to take. At a thrift store, the men’s shoe selection will typically be larger than the women’s shoes. We need the opposite, so we have to tailor our donations requests.
This data allows us to make the Transform experience even better. When we know our clients’ specific needs, we can create specific accommodations. We hope you found this as enlightening as we did!


